There are three steps to forecasting an end date using Monte:
- Collect historical data
- Identify the number of remaining tasks
- Run the simulation
Let’s talk through each of these.
Collect historical data
You need to collect the number of tasks completed per week in the past for as many weeks as you can get. You can get started with as little as 4 weeks of data, but results will be best when you have 6 months or more.
Many estimation methods require the length of time that each task took in the past. That’s not necessary. Just knowing how many tasks completed per week in the past is enough.
It’s perfectly acceptable to have weeks where zero tasks are completed. That’s an important part of the historical data that needs to be accounted for in the forecast.
Identify the number of remaining tasks
To forecast the end date, you need to know how many tasks it will take to finish the project. This can be a simple list of tasks or a full work breakdown structure, however makes sense for you and your project. In the end you just need a count of the number tasks you expect are needed to complete the project.
Run the simulation
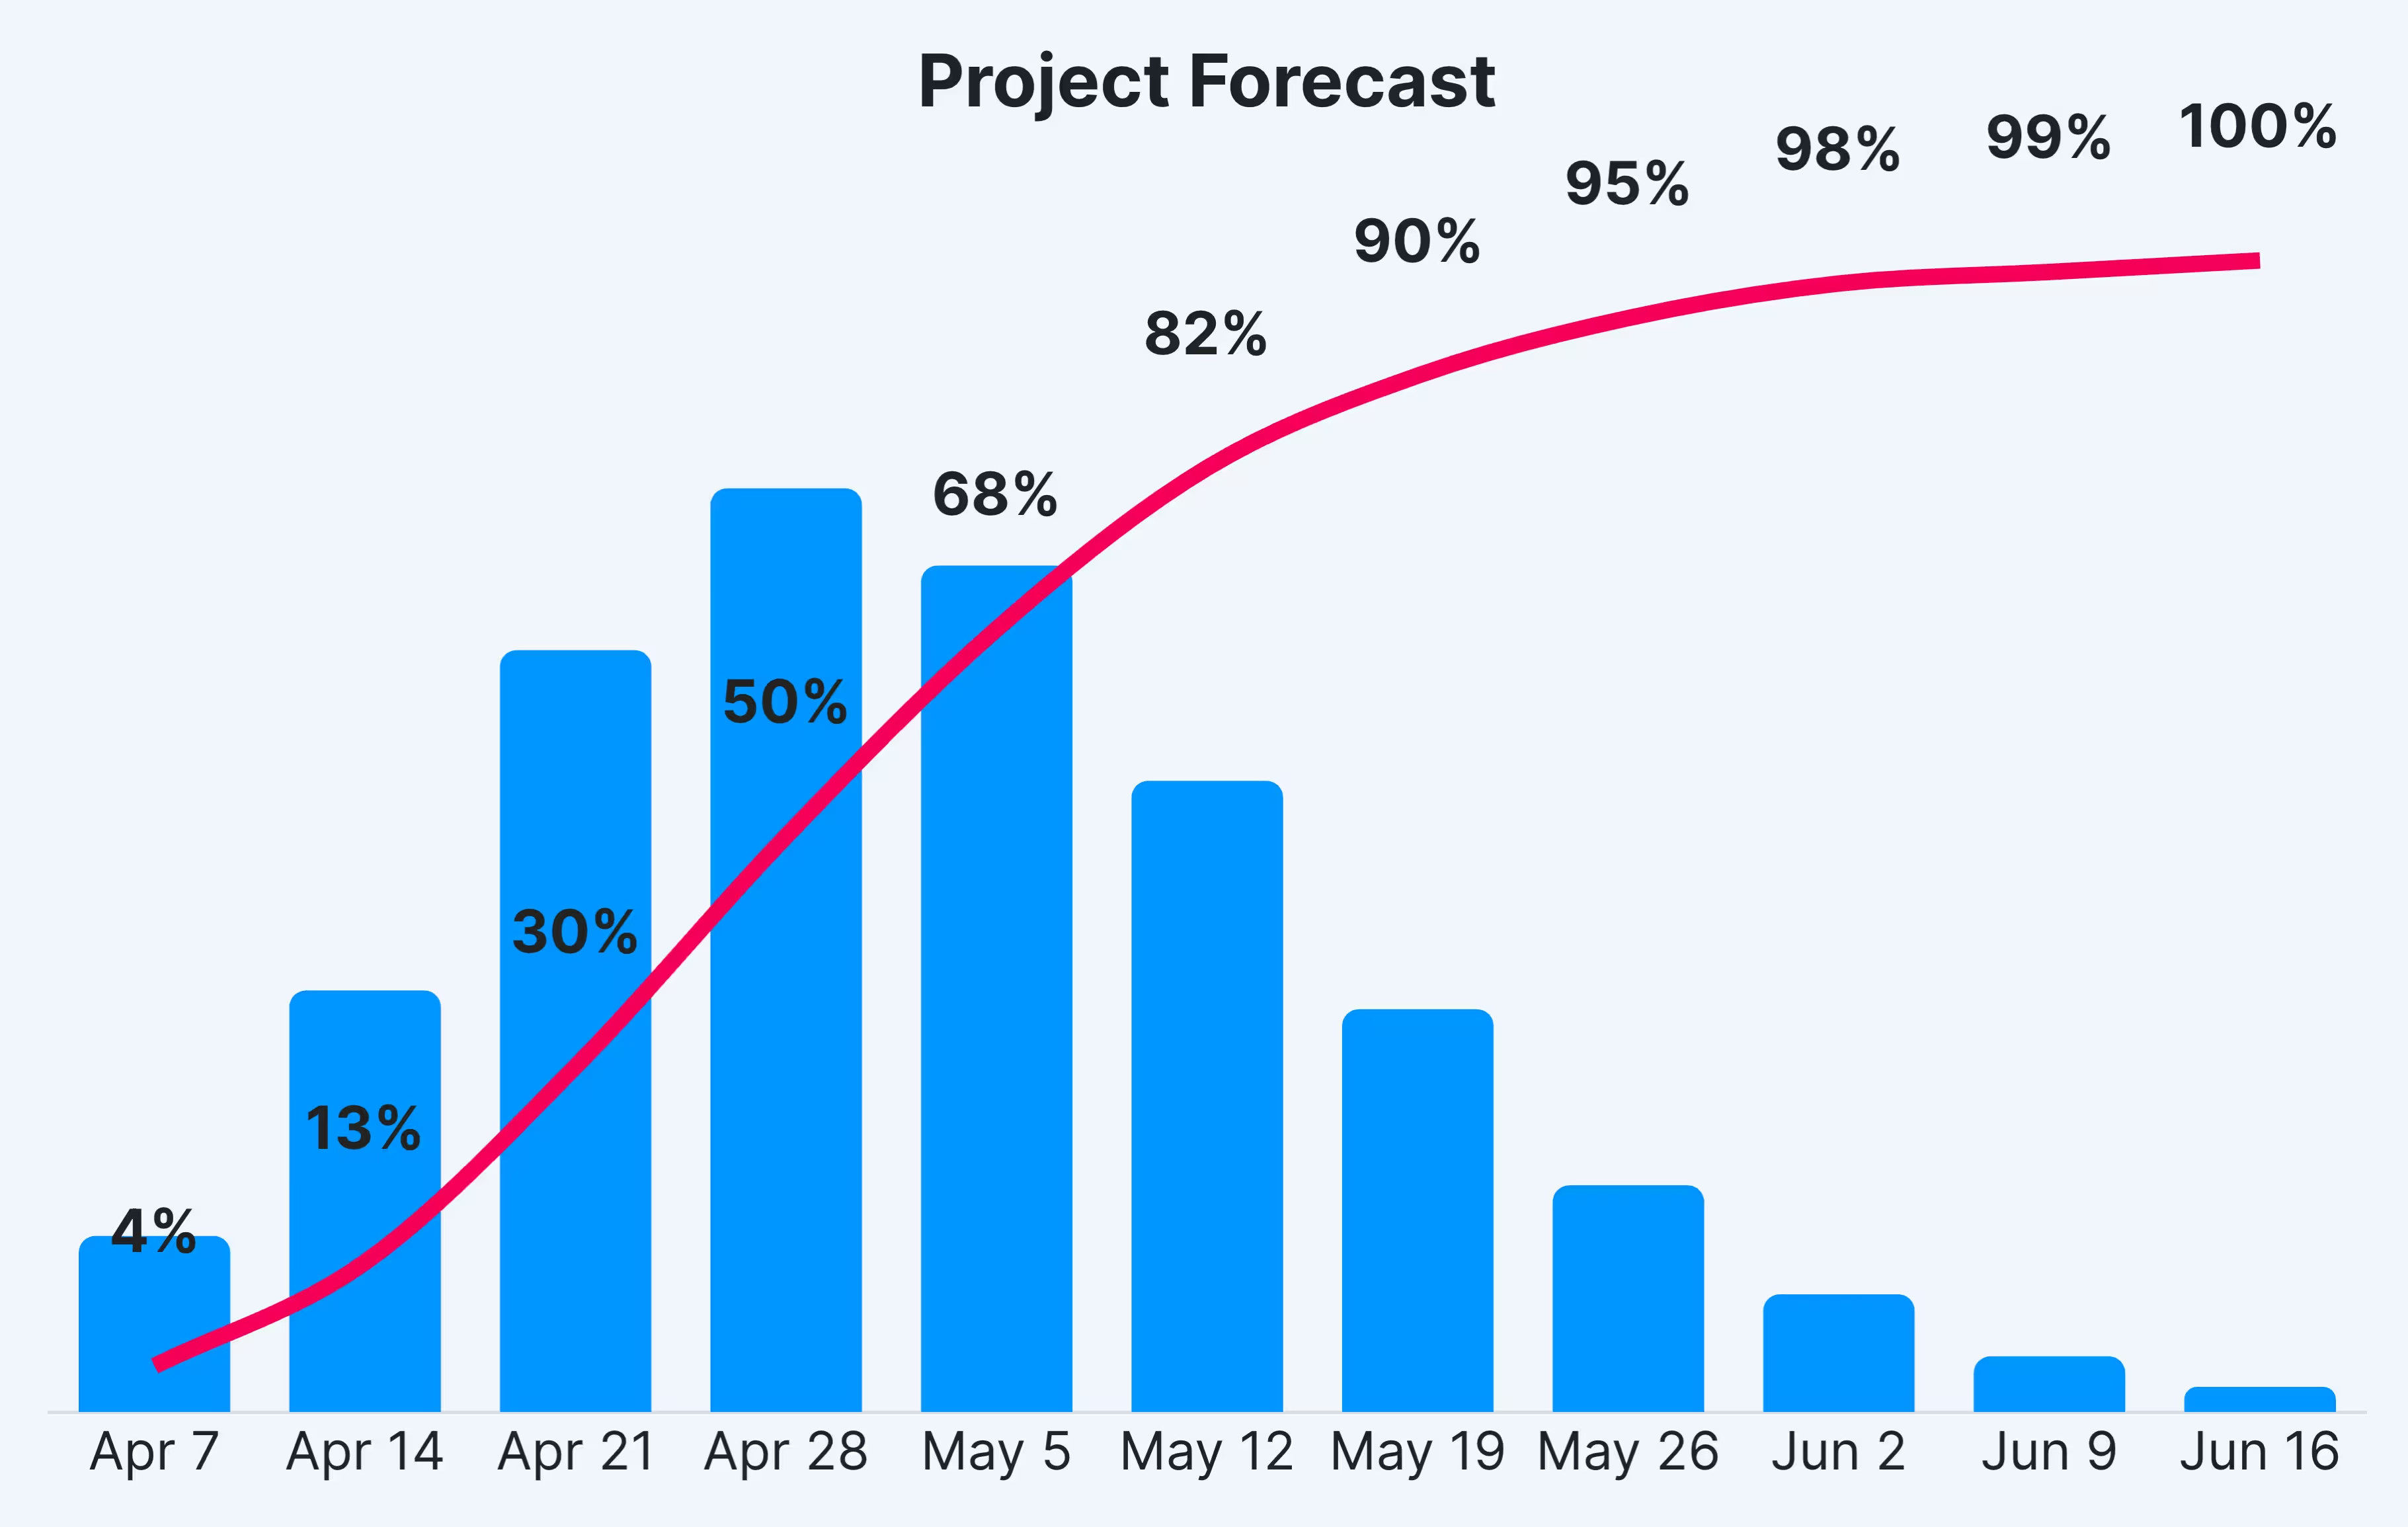
This is the easiest part. After inputting the number of tasks completed per week and the number of tasks remaining, run the simulation and it will calculate a chart of probable end dates. You’ll see a chart like this:

Using your data, in just a second or two Monte will run 1,000,000 project simulations and return the results as a forecast chart. Next, what does that chart mean?
